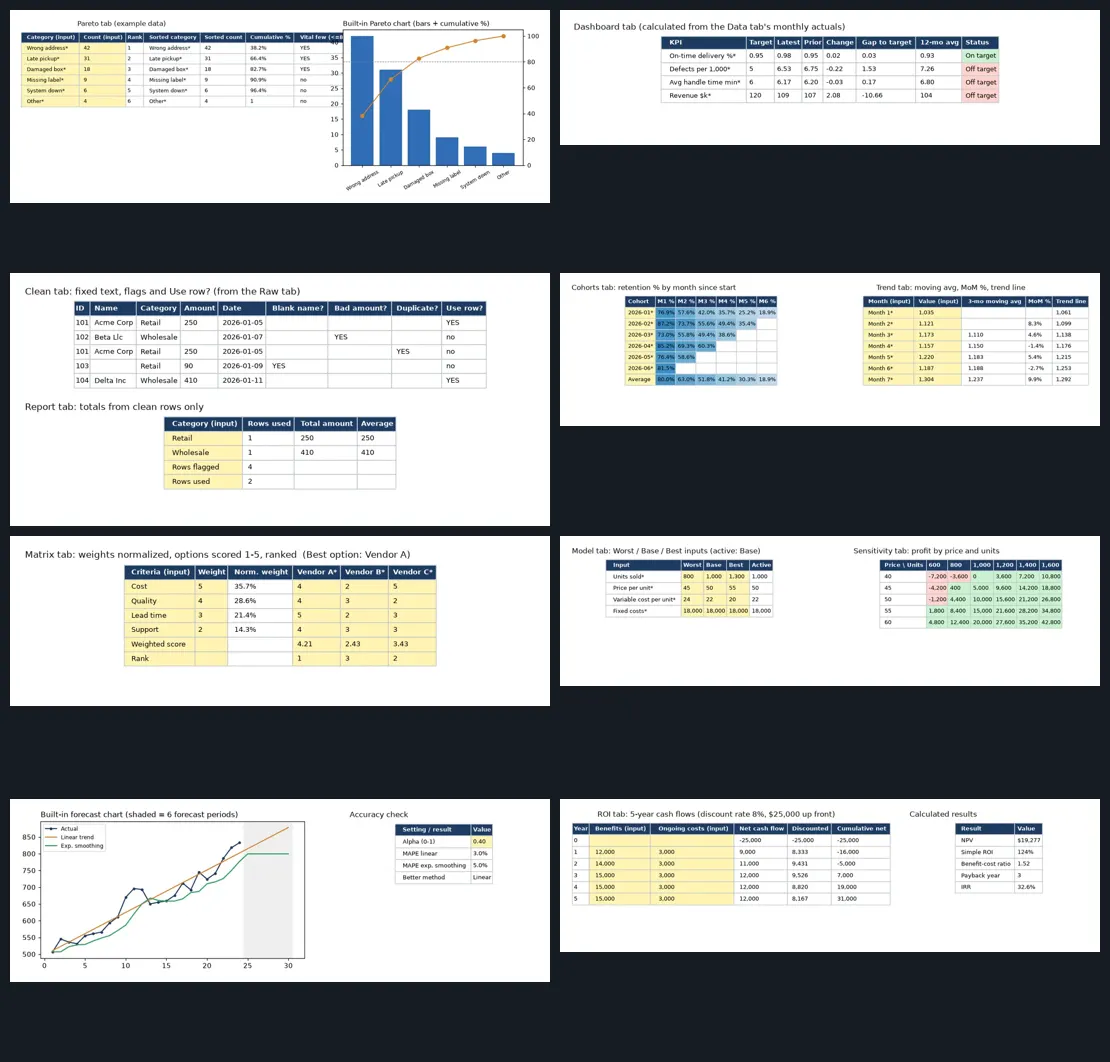
Free tools on our sites stay free. These templates are an optional paid upgrade. Each is an instant-download .xlsx with live formulas, marked input cells, example data and a Start Here tab. Photos are rendered from each workbook's own example data; swipe or scroll each gallery for more.
Lean Six Sigma
Pareto Analysis Calculator
$7 USD · one-time payment
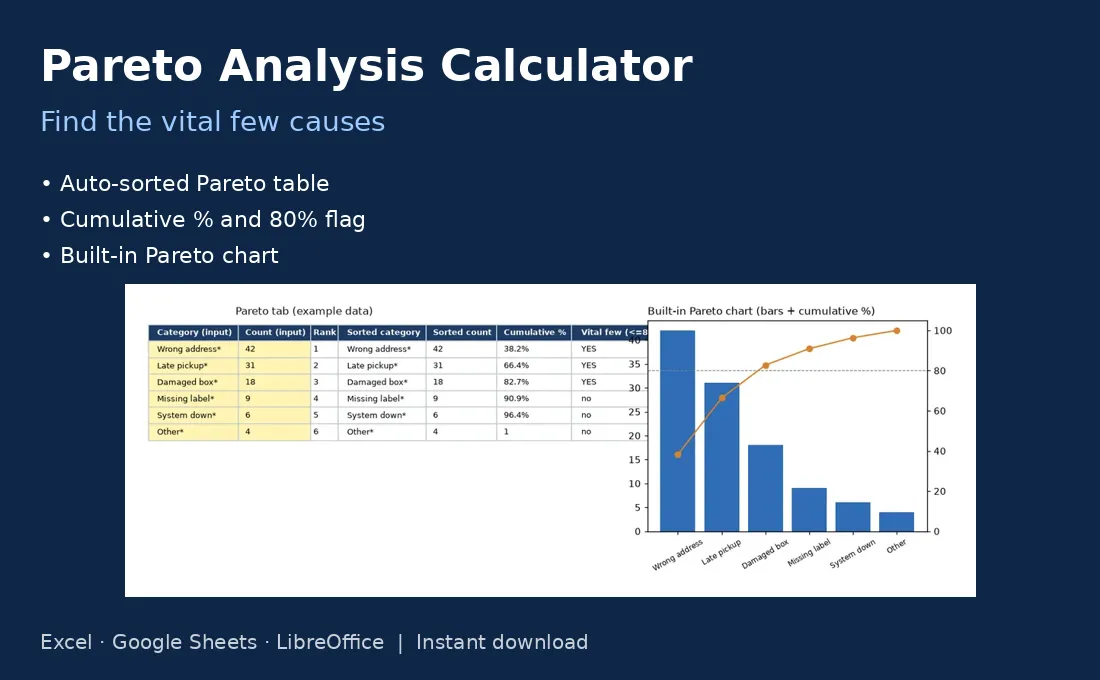
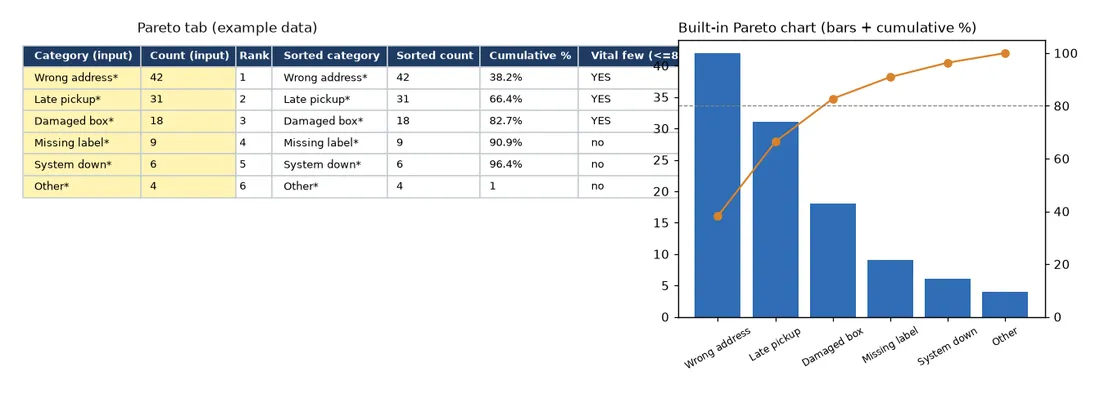
Enter categories and counts to get a sorted Pareto chart, cumulative % and the vital few flagged at 80%.
Rank complaints, defects or delays so you fix the few causes behind most of the problem first.
HIGHLIGHTS
- Type categories and counts; the table re-sorts itself, largest first
- Cumulative % with a YES flag on the vital few
- Built-in combo chart: count bars plus a cumulative % line
- Example: six shipping problems, ready to replace
WHAT'S INCLUDED
- Pareto tab: up to 30 category rows, rank, sorted table, cumulative %, vital-few flag and chart
- Start Here tab with instructions
- Works in Excel, Google Sheets and LibreOffice; yellow cells are inputs, EXAMPLE rows show how it works
HOW TO USE
- Type each category and how many times it happened.
- Read the sorted table: YES rows are your vital few.
- Paste the chart into your report or A3.
Business intelligence & analytics
KPI Dashboard
$12 USD · one-time payment
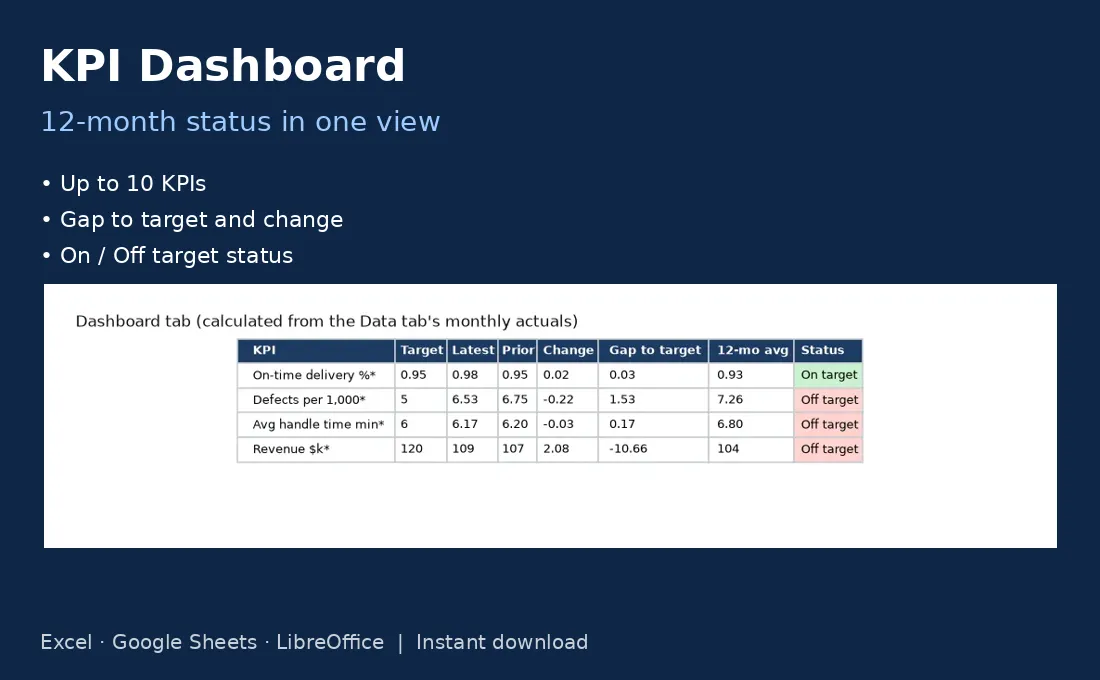
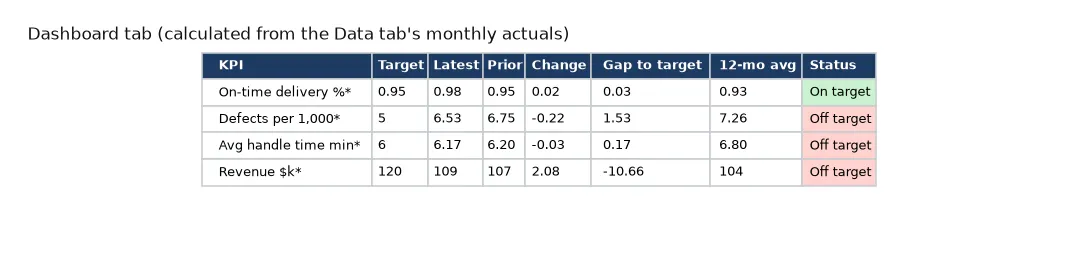
Track up to 10 KPIs over 12 months: latest vs prior, gap to target, 12-month average and color-coded status.
Turn a grid of monthly numbers into a one-screen status view, so the monthly review starts with what is off target.
HIGHLIGHTS
- Up to 10 KPIs with a target and a Higher-or-Lower-is-better setting
- Latest, prior month, change and gap to target
- 12-month average and an On target / Off target status that respects direction
- Tables only, no charts; works for any metric you already track
WHAT'S INCLUDED
- Data tab: KPI list with 12 monthly inputs
- Dashboard tab: calculated status table
- Start Here tab
- Works in Excel, Google Sheets and LibreOffice; yellow cells are inputs, EXAMPLE rows show how it works
HOW TO USE
- List your KPIs, targets and direction on the Data tab.
- Enter each month's actual as it comes in.
- Open the Dashboard tab to see what is on or off target.
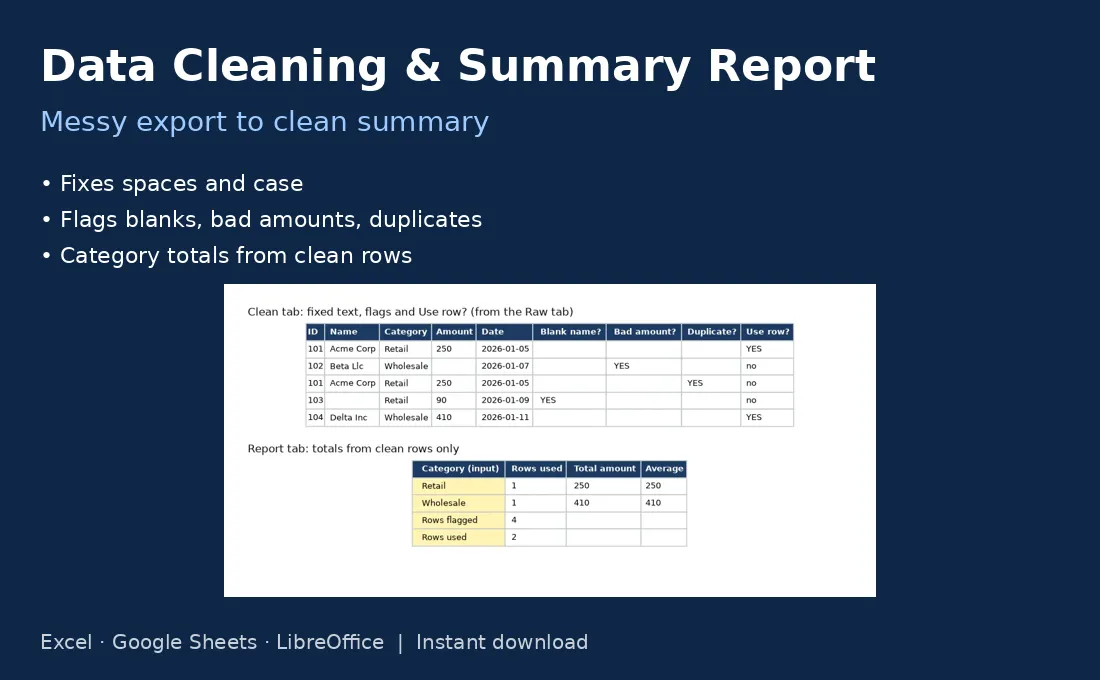
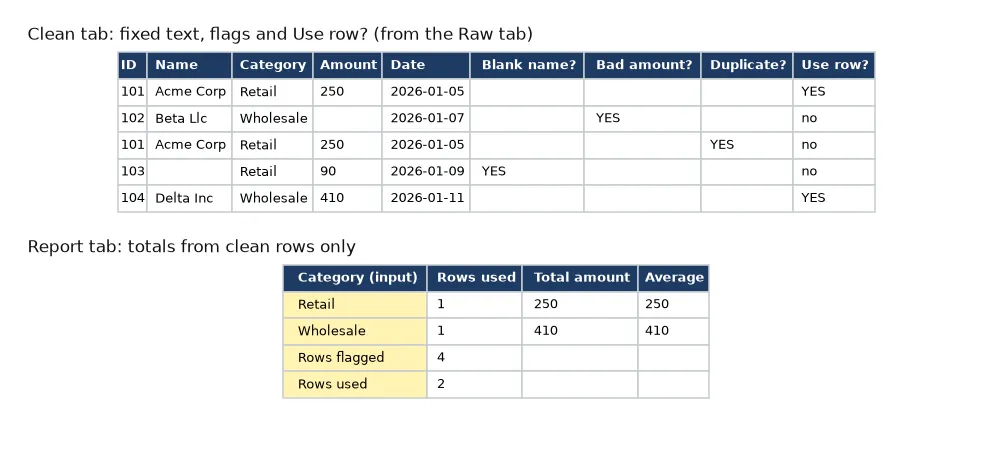
Data Cleaning & Summary Report
$7 USD · one-time payment
Trims and fixes text, flags blanks, non-numeric amounts and duplicates, then summarizes clean rows by category.
Paste a messy CRM, sales or expense export and get a cleaned copy plus category totals that skip the problem rows.
HIGHLIGHTS
- Trims stray spaces and fixes capitalization in names and categories
- Flags blank names, non-numeric amounts and repeated rows
- Marks each row usable or not, up to 500 rows
- Category totals and averages from clean rows only, with flagged and used counts
WHAT'S INCLUDED
- Raw tab: paste ID, Name, Category, Amount, Date
- Clean tab: fixed values and flags
- Report tab: totals by category
- Start Here tab
- Works in Excel, Google Sheets and LibreOffice; yellow cells are inputs, EXAMPLE rows show how it works
HOW TO USE
- Paste your rows into the Raw tab.
- Check the YES flags on the Clean tab and fix the source if needed.
- Type your category names on the Report tab to get totals.
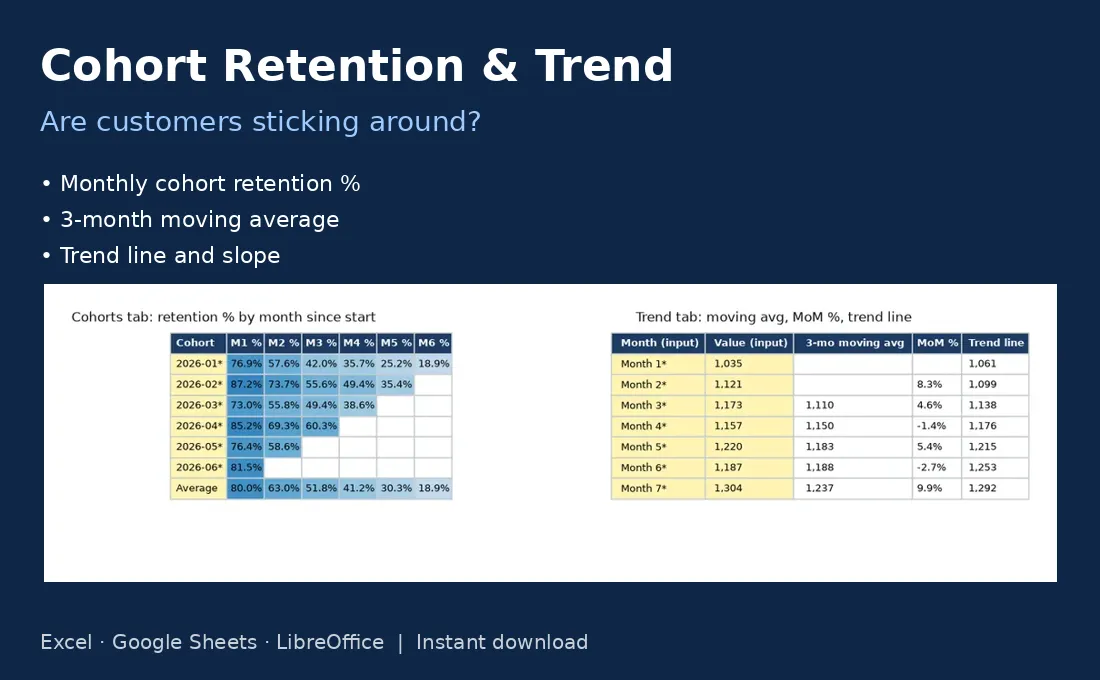
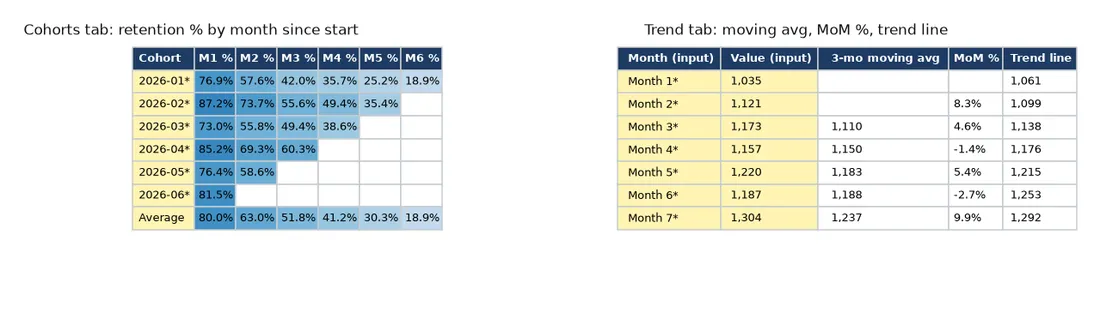
Cohort Retention & Trend Analysis
$9 USD · one-time payment
Monthly cohort retention grid plus a trend sheet with moving average, month-over-month change and linear trend.
See whether customers who joined in different months stick around, and whether a monthly number is truly rising once noise is smoothed out.
HIGHLIGHTS
- Retention % for each monthly cohort, up to six months after start
- Average retention row across cohorts
- Trend tab: 3-month moving average and month-over-month %
- Fitted trend line with slope per period, up to 24 months
WHAT'S INCLUDED
- Cohorts tab: start size and active counts, retention grid
- Trend tab: one monthly series with smoothing and trend
- Start Here tab
- Works in Excel, Google Sheets and LibreOffice; yellow cells are inputs, EXAMPLE rows show how it works
HOW TO USE
- Enter each cohort's starting count and later active counts.
- Enter one monthly series on the Trend tab.
- Compare cohort rows and read the slope for direction.
Decision support
Weighted Decision Matrix
$6 USD · one-time payment
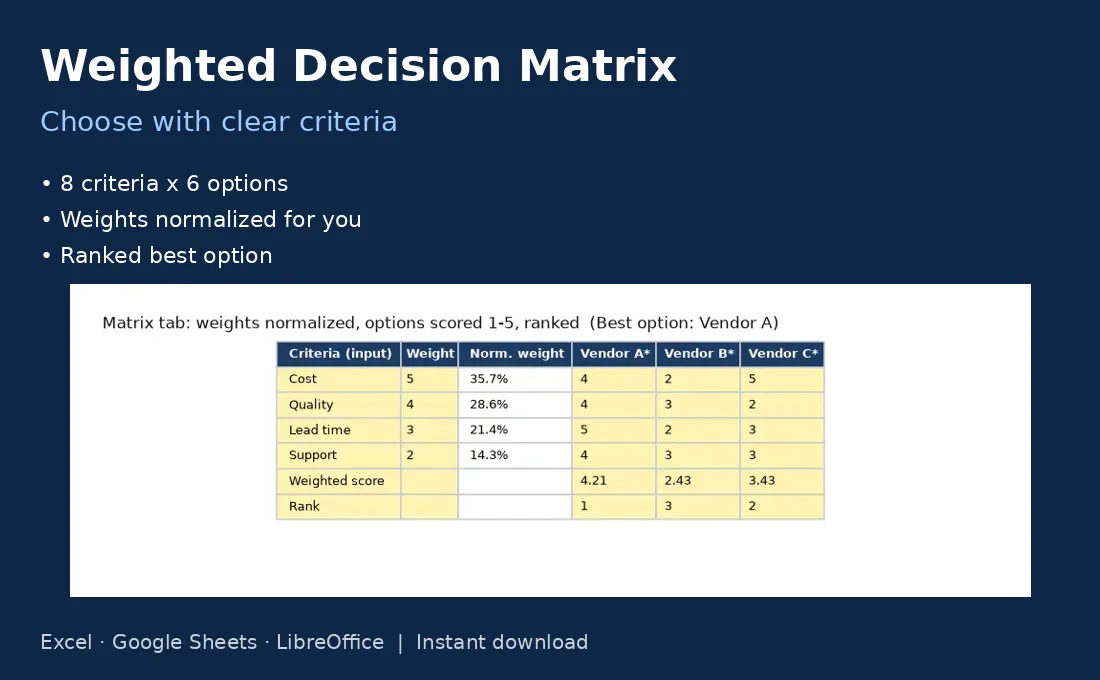
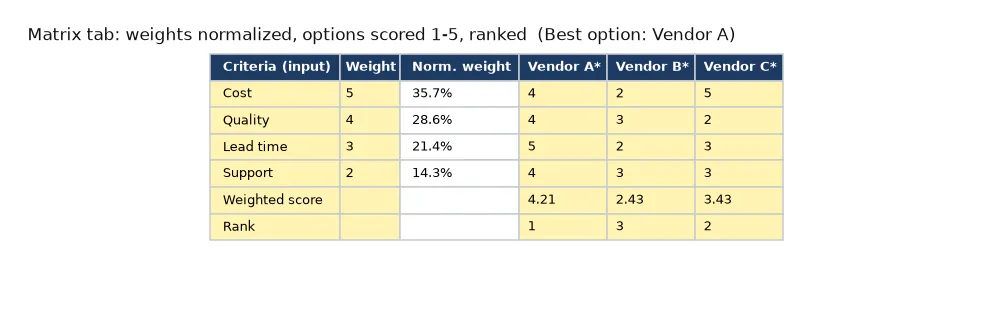
Score up to 6 options against 8 weighted criteria and see the ranked best option.
Make a choice between options explicit: agree on what matters and how much, score each option, and let the sheet rank them.
HIGHLIGHTS
- Up to 8 criteria with weights on any scale, normalized for you
- Up to 6 options scored 1-5 with input validation
- Weighted score and rank for every option
- Best option named; example compares three vendors
WHAT'S INCLUDED
- Matrix tab: criteria, weights, scores, ranks and best option
- Start Here tab
- Works in Excel, Google Sheets and LibreOffice; yellow cells are inputs, EXAMPLE rows show how it works
HOW TO USE
- List the criteria and give each a weight.
- Score every option 1-5 on each criterion.
- Read the rank and best option, then discuss close calls.
Scenario & What-If Model
$9 USD · one-time payment
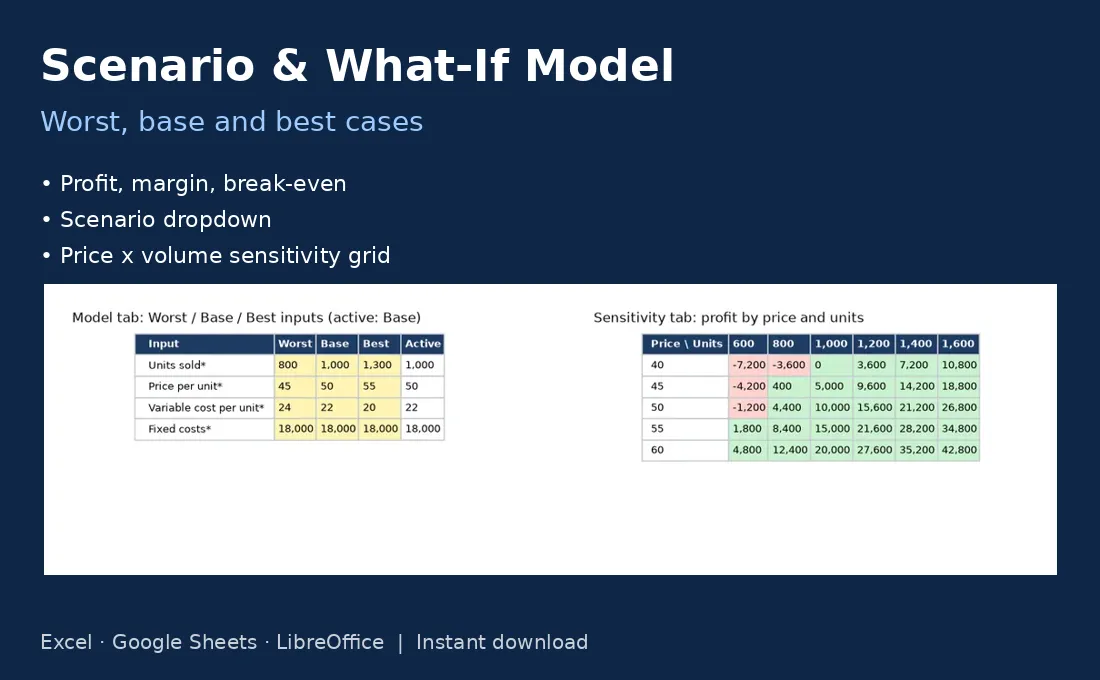
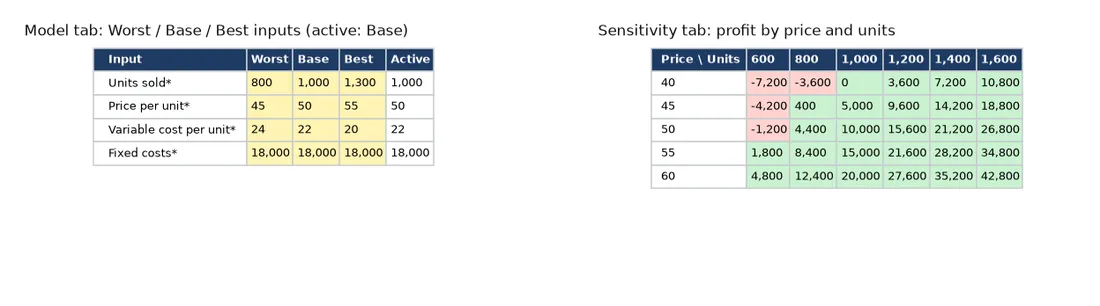
Worst, base and best cases with profit, margin, break-even and a price-by-volume sensitivity grid.
Answer "what if sales come in low?" before you commit, by comparing three cases and seeing how profit moves with price and volume.
HIGHLIGHTS
- Worst, Base and Best inputs for units, price, variable cost and fixed costs
- Dropdown to switch the active scenario
- Revenue, contribution, profit, margin and break-even update instantly
- 5 x 6 sensitivity grid of profit by price and units
WHAT'S INCLUDED
- Model tab: scenario inputs and results
- Sensitivity tab: profit grid
- Start Here tab
- Works in Excel, Google Sheets and LibreOffice; yellow cells are inputs, EXAMPLE rows show how it works
HOW TO USE
- Enter your worst, base and best assumptions.
- Switch the active scenario to compare results.
- Use the grid to spot price and volume pairs that lose money.
Simple Forecasting
$8 USD · one-time payment
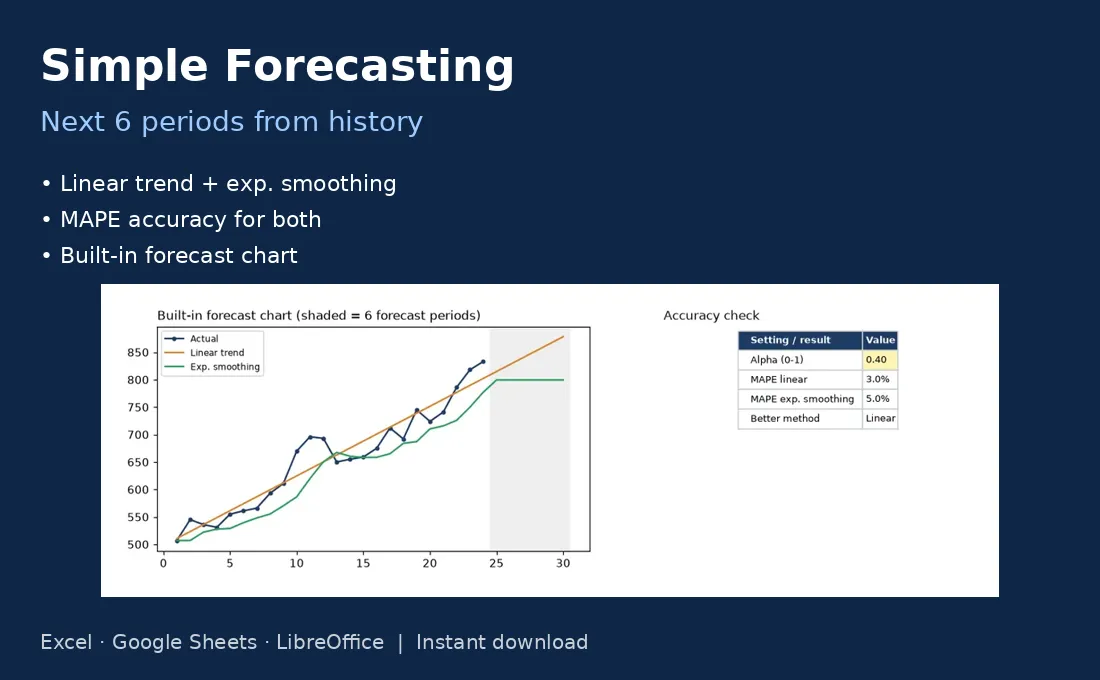
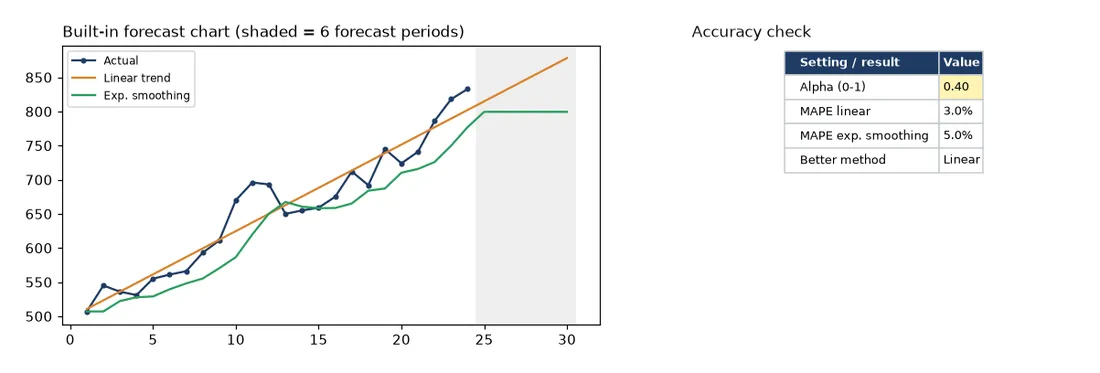
Linear trend and exponential smoothing forecasts, MAPE accuracy check and automatic best-method pick.
Get a defensible short-term forecast from monthly history, and learn which of two simple methods fits your past data better.
HIGHLIGHTS
- Linear trend forecast and exponential smoothing with adjustable alpha
- Absolute % error per period and MAPE for each method
- Better method picked automatically
- Built-in line chart; six forecast periods, history up to 24 points (minimum 6)
WHAT'S INCLUDED
- Forecast tab: history, both forecasts, errors, MAPE and chart
- Start Here tab
- Works in Excel, Google Sheets and LibreOffice; yellow cells are inputs, EXAMPLE rows show how it works
HOW TO USE
- Enter your monthly history in the Actual column.
- Adjust alpha to make smoothing react faster or slower.
- Use the method with the lower MAPE for the next six periods.
Cost-Benefit & ROI Calculator
$8 USD · one-time payment
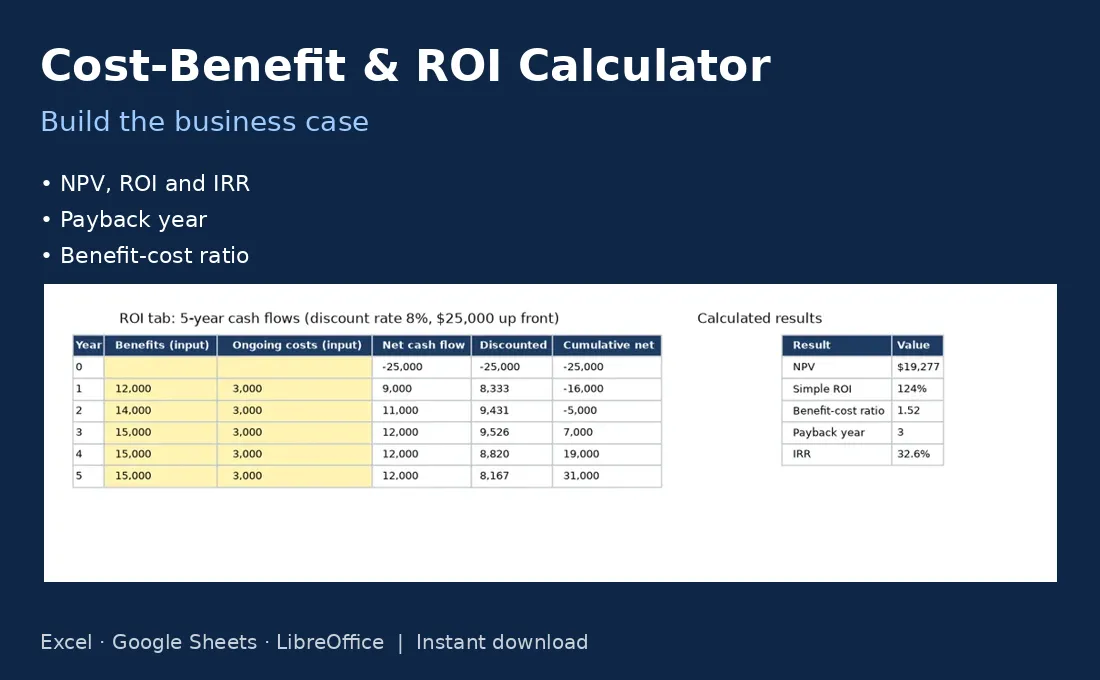
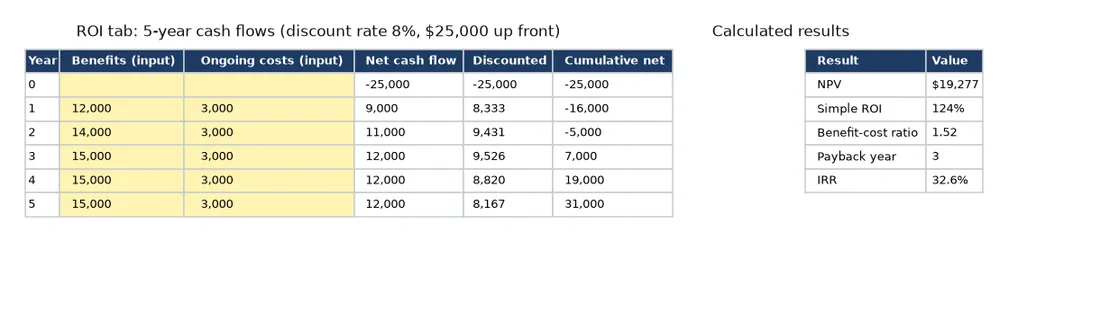
Five-year cash flows with NPV, ROI, benefit-cost ratio, payback year and IRR.
Put a proposed project or purchase into the numbers finance asks for, so the business case fits on one page.
HIGHLIGHTS
- One-time cost plus five years of benefits and ongoing costs
- Net, discounted and cumulative cash flow by year
- NPV, simple ROI and discounted benefit-cost ratio
- Payback year and IRR
WHAT'S INCLUDED
- ROI tab: inputs, cash flows and results
- Start Here tab
- Works in Excel, Google Sheets and LibreOffice; yellow cells are inputs, EXAMPLE rows show how it works
HOW TO USE
- Enter the up-front cost and your discount rate.
- Fill in each year's expected benefits and costs.
- Quote NPV, payback and IRR in your proposal.
Bundles
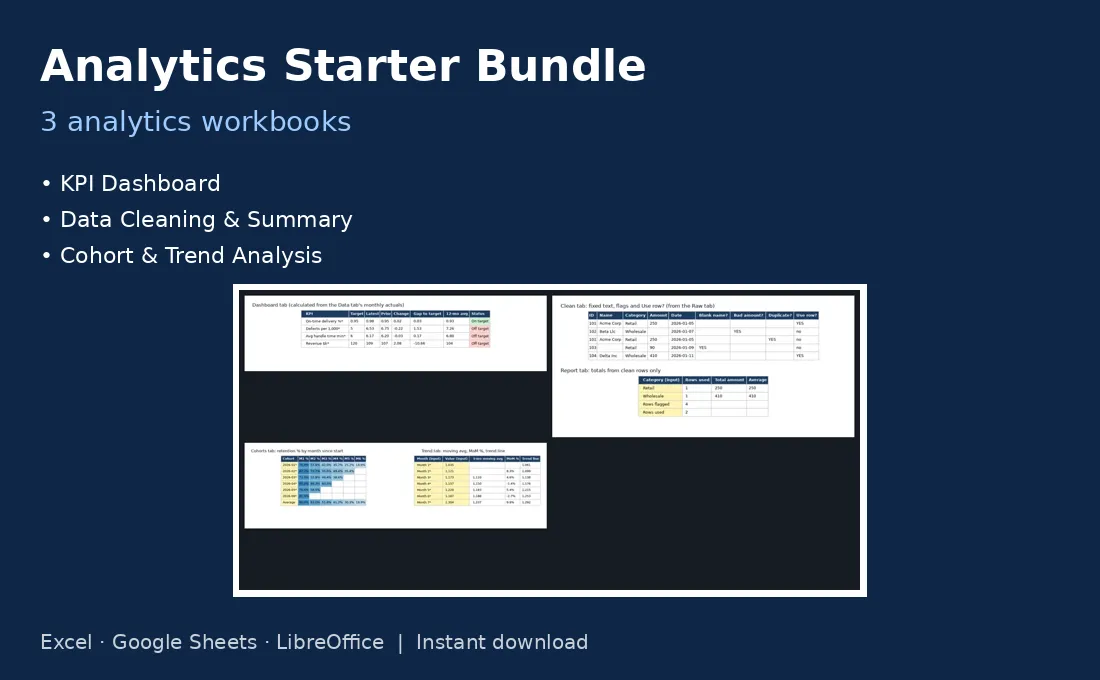
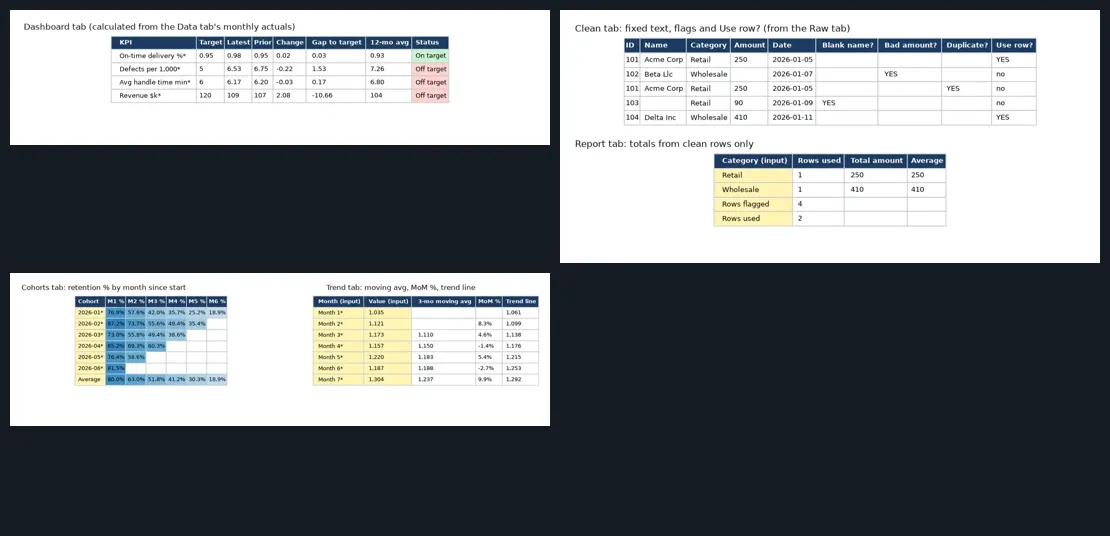
Analytics Starter Bundle
$19 USD · one-time payment
KPI Dashboard, Data Cleaning & Summary Report, and Cohort & Trend Analysis.
WHAT'S INCLUDED
- KPI Dashboard
- Data Cleaning & Summary Report
- Cohort Retention & Trend Analysis
Clean the data, track the monthly numbers, then check retention and trend.
Buy now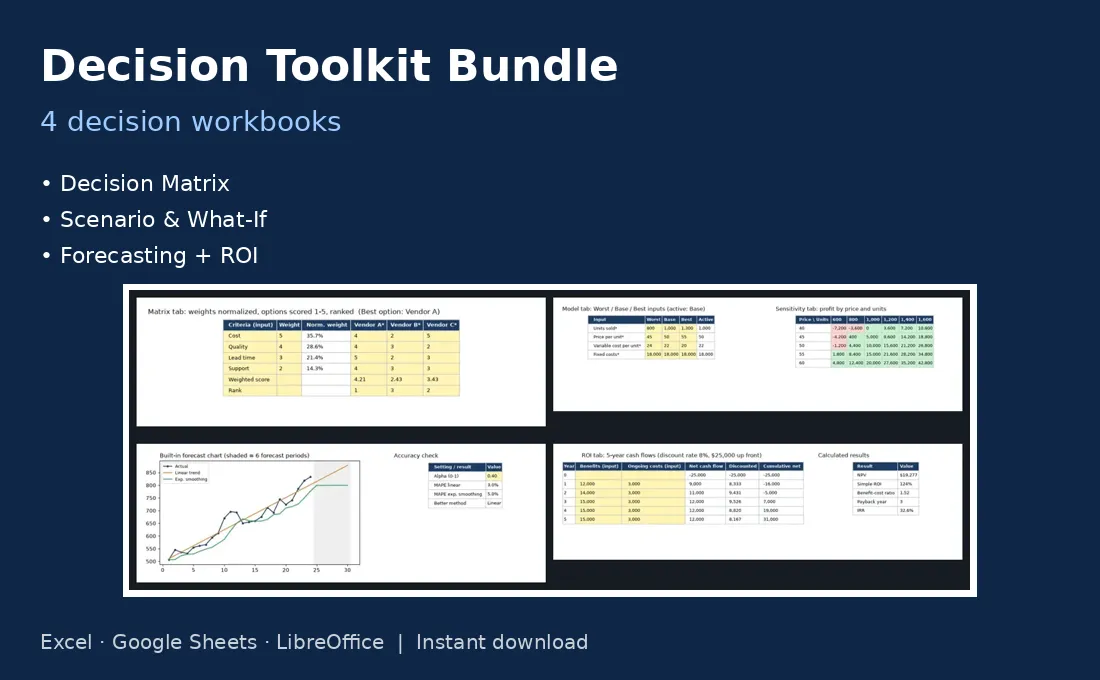
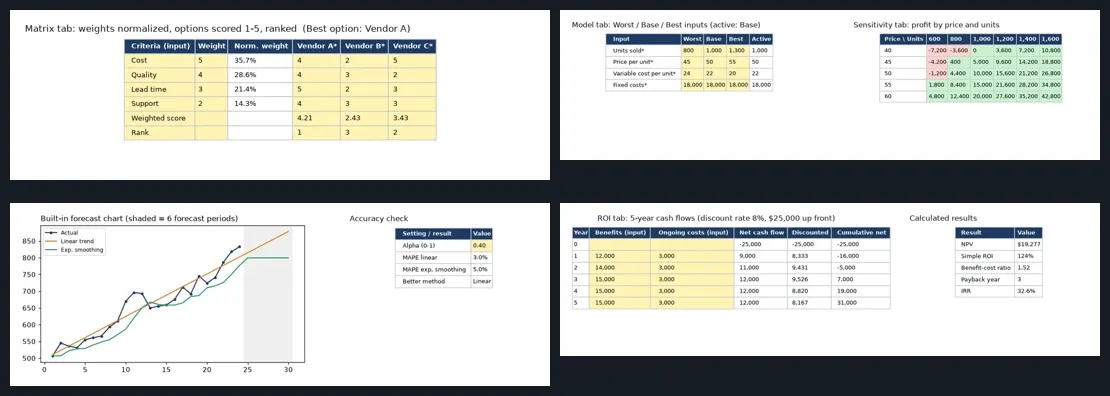
Decision Toolkit Bundle
$19 USD · one-time payment
Weighted Decision Matrix, Scenario & What-If, Simple Forecasting and Cost-Benefit & ROI.
WHAT'S INCLUDED
- Weighted Decision Matrix
- Scenario & What-If Model
- Simple Forecasting
- Cost-Benefit & ROI Calculator
Forecast demand, test scenarios, price the investment and compare the options.
Buy now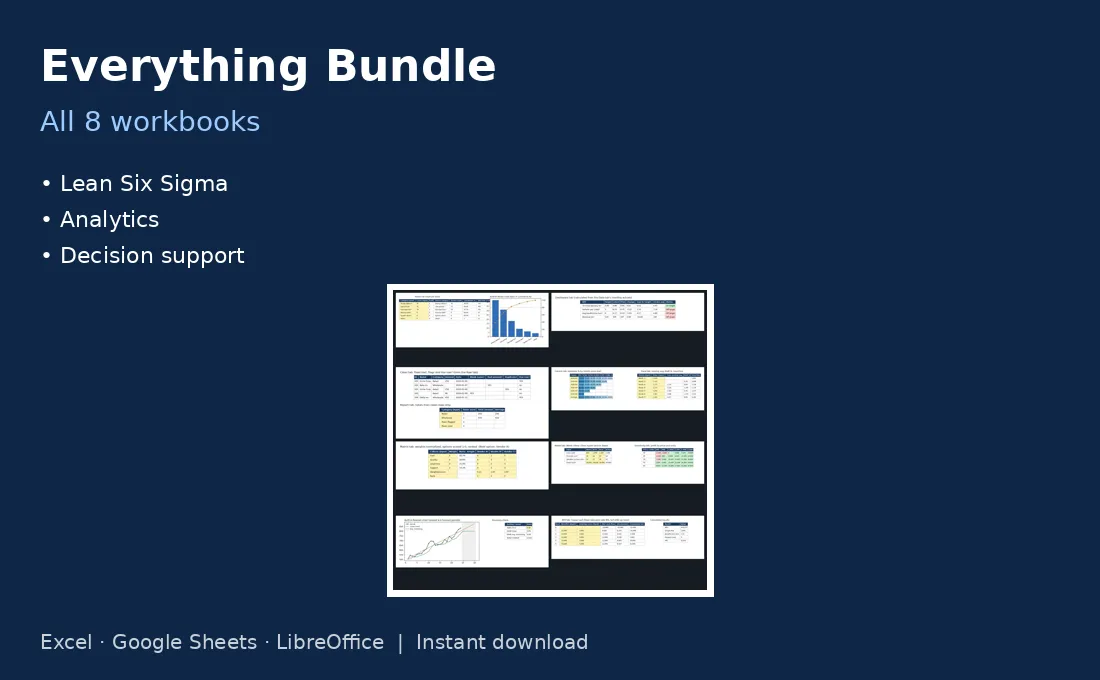
Everything Bundle
$49 USD · one-time payment
Every template in this store across Lean Six Sigma, analytics and decision support.
WHAT'S INCLUDED
- Pareto Analysis Calculator
- KPI Dashboard
- Data Cleaning & Summary Report
- Cohort Retention & Trend Analysis
- Weighted Decision Matrix
- Scenario & What-If Model
- Simple Forecasting
- Cost-Benefit & ROI Calculator
All eight workbooks in one download.
Buy nowPurchase, refunds & terms
Checkout and payment are handled securely by Lemon Squeezy, our merchant of record. Prices are one-time payments in USD with no subscription; your download link is emailed right after purchase. Because these are digital downloads, sales are generally final, but if a file is faulty or not as described, email us within 30 days for a fix or a refund. Templates are licensed for your personal or internal business use and may not be resold.
Contact
Questions or support: scholarshipsendingsoon@gmail.com